
Crypto & Trading
The Psychology of Extended-Hours Trading: Filtering Post-Market Movers Without Falling for Low-Liquidity Traps


Ask a daytime trader what ruins their account, and they will usually point to bad execution or poor risk management. Ask someone who trades after the closing bell, and the answer almost always comes down to psychology. Extended-hours sessions promise early entries before the rest of the market reacts — but they also set emotional traps that daytime sessions rarely present.
Key Takeaways
- Thin market liquidity during extended sessions inflates price volatility, making emotional control far more important than technical indicator complexity.
- Institutional order flow operates differently outside regular hours, increasing the risk of false breakout traps on low volume.
- Systematic volume filters and objective screeners help traders separate meaningful price moves from temporary market noise.
Navigating extended sessions requires combining cold discipline with dynamic volume filters. Here is how to filter off-hours volatility, manage your psychology, and avoid falling into low-liquidity traps.
1. The Emotional Pitfalls of Extended Sessions
Trading outside standard session hours introduces psychological pressure points that catch even experienced traders off guard. When major earnings reports drop after the bell, initial price swings look explosive on an intraday chart.
Seeing a stock jump five or ten percent in minutes frequently triggers an intense fear of missing out. Inexperienced traders often rush in with market orders at the peak of a price spike — only to watch the market reverse as momentum fades.
Maintaining discipline outside regular hours requires understanding why extended session price action behaves so erratically. Institutional market makers pull back quotes after the close, depth of market drops, and bid-ask spreads expand. What appears to be a powerful breakout on a price chart is often just a few aggressive retail orders sweeping through an empty order book. Recognizing these underlying liquidity dynamics will keep you grounded — stopping emotional impulses from driving execution.
2. Spotting Liquidity Traps in Off-Hours Price Action
Liquidity traps occur when thin order flow creates dramatic price swings that lack institutional backing.
During regular trading hours, continuous buying and selling interest creates natural price stability. Outside those hours, a single market order can push prices multiple percentage points. This happens because resting limit orders are sparse. Traders who evaluate price charts without analyzing volume frequently mistake these low-liquidity spikes for genuine structural trends.
To avoid falling into liquidity traps, traders must evaluate volume distribution alongside price movement. Adding volume profile tools to off-hours charts confirms whether a price move reflects genuine institutional capital commitments. When screening for active stocks after the bell, filter for after hours market movers that demonstrate heavy relative volume. This prevents taking high-risk positions in illiquid conditions.
Evaluating volume ensures that you only react to price moves backed by real financial participation.
3. Constructing an Objective Screening Routine
Developing a disciplined off-hours workflow requires building clear technical filters before placing trades. Rather than chasing every stock that appears on a post-close gainers list, successful traders enforce strict volume and price parameters. Setting minimum volume thresholds and requiring price consolidation before taking entries drastically reduces false breakout signals.
Another essential filter involves evaluating bid-ask spread width relative to share price. When spreads widen significantly during off-hours trading, execution costs rise — eating into profit margins. Comparing extended session volume against a stock’s 20-day average volume provides instant clarity regarding market participation.
If screening tools identify post-market movers that exhibit weak volume alongside wide spreads, standing aside remains the most prudent decision. Objective screening criteria eliminate guesswork and prevent impulsive choices.
4. Extended-Hours Session Comparison Matrix
| Session Metric | Standard Daytime Session | Extended-Hours Session | Execution Adjustment |
| Market Liquidity | High volume, tight spreads | Low volume, wide spreads | Use limit orders exclusively |
| Volatility Source | Institutional order flow | Low-volume order sweeps | Filter for after-hours market movers with volume |
| Execution Quality | Fast fills, low slippage | Variable fills, higher slippage | Scale down position size to control risk |
| Psychological Risk | Over-trading setups | Chasing price spikes | Wait for price consolidation before entering |
Table 1: Extended-Hours Session Comparison Matrix
5. Structural Rules for Off-Hours Risk Control
Long-term survival in extended-hours trading relies on strict execution guidelines designed to protect capital.
First, you must always use limit orders when opening or closing positions outside regular hours. Placing market orders into thin order books leads to severe execution slippage — filling orders at prices far worse than expected. Second, position sizing should be scaled down significantly to compensate for wider spreads and erratic price swings.
Establishing clear risk limits per trade prevents an illiquid price move from causing heavy drawdown. Utilizing automated alert features will allow you to track key price levels passively without staring at tick-by-tick fluctuations — which frequently induces over-trading.
If post-market movers fail to hold directional momentum into the pre-market session, close positions early or step aside. Doing so will keep your capital safe for higher-quality setups during regular market hours.
Mastering Off-Hours Trading Psychology
Navigating extended-hours trading successfully is less about finding secret indicators and more about mastering emotional control and liquidity evaluation. Enforcing strict volume filters, watching spread widths, and relying exclusively on limit orders will help you navigate off-hours volatility safely — helping you avoid costly liquidity traps along the way.



A few years ago, quantum computing felt like something security teams could safely park in the “later” column. Now it’s turning up in board decks, architecture reviews, regulatory conversations, and awkward budget meetings.
Not because a cryptographically relevant quantum computer is breaking production encryption today. Because encrypted data stolen today may still be valuable when quantum capability catches up.
That’s the uncomfortable part.
For organizations handling financial records, health data, intellectual property, payment information, government-related data, or long-lived customer records, Post Quantum Cryptography has moved from research to risk planning. It’s not a panic item. But it isn’t optional background reading anymore either.
Why Quantum Computing Changes the Cryptography Plan
Most enterprise trust still sits on public-key cryptography. RSA and elliptic curve cryptography help protect TLS sessions, VPNs, code signing, certificates, identity systems, payment flows, email security, and APIs that nobody has mapped in years.
The risk comes from math.
A powerful enough quantum computer could use Shor’s algorithm to break the hard problems that make many current public-key systems safe. That doesn’t mean every encryption method collapses at once. Symmetric encryption is in a better position, especially with stronger key lengths. Public-key infrastructure is the sharper concern.
And PKI is everywhere.
That’s why Post Quantum Cryptography matters before the quantum threat becomes visible in normal incident data. If security teams wait for proof in the wild, the migration window may already be too tight.
The Business Risk Starts Before the Breakthrough
Here’s the board-level version: data has a shelf life, and some of it has a long one.
Picture a mid-size financial services firm moving sensitive workloads into hybrid cloud. Client records, transaction histories, contracts, authentication logs, merger discussions, and legal documents may remain sensitive for ten years or more. If attackers capture encrypted traffic now and store it, they may try to decrypt it later when quantum computing becomes practical enough.
That’s the “harvest now, decrypt later” problem.
NIST has already finalized its first Post Quantum cryptography standards and says organizations should begin migrating systems to quantum-resistant cryptography. The first three standards cover key establishment and digital signatures. This isn’t just a government memo. It’s a planning signal for enterprises.
What Post Quantum Cryptography Actually Means
Post Quantum cryptography refers to cryptographic algorithms built to resist attacks from both classical and quantum computers. The key point is practical: PQC doesn’t require organizations to run quantum hardware.
Unlike quantum key distribution, PQC can often be introduced through software, firmware, protocol, platform, and certificate updates. That doesn’t make the shift easy, but it does make it realistic for enterprise environments with existing networks, cloud workloads, and security controls.
Organizations comparing quantum-safe approaches can also review Post Quantum Cryptography for businesses when looking at how cryptographic planning connects with key exchange and future security models.
Algorithms Security Teams Should Recognize
The names will start appearing in architecture documents, vendor roadmaps, and compliance conversations:
- ML-KEM, based on CRYSTALS-Kyber, for key establishment
- ML-DSA, based on CRYSTALS-Dilithium, for digital signatures
- SLH-DSA, based on SPHINCS+, for stateless hash-based digital signatures
- FALCON, still relevant in Post Quantum signature discussions
Don’t treat the names as trivia. They’ll affect certificates, handshakes, code signing, device updates, and interoperability testing. NIST’s post-quantum cryptography project identifies FIPS 203, FIPS 204, and FIPS 205 as the principal standards released in 2024.
Start With Cryptographic Visibility
The first practical step isn’t replacing algorithms. It’s finding them. Many enterprises don’t have a clean map of where cryptography lives. Some of it is obvious: TLS, VPNs, certificate authorities, HSMs, identity platforms.
Some of it is buried inside applications, appliances, embedded systems, old Java services, partner integrations, or scripts written by someone who left five years ago.
Build a Cryptographic Inventory
A useful inventory should identify:
- Public-key algorithms currently in use
- Certificate authorities, certificate lifetimes, and renewal processes
- Systems using RSA, ECC, or older TLS configurations
- Long-lived sensitive data stores
- Code signing and firmware signing workflows
- Third-party products that depend on vulnerable algorithms
- Applications that can’t easily be modified
This is where reality gets messy.
A SOC lead may think the issue belongs to architecture. Architecture may think it belongs to infrastructure. Infrastructure may point to application teams. Meanwhile, procurement is still buying systems with no Post Quantum migration questions in the review process.
Ownership matters more than people expect.
Prioritize by Data Longevity
Not every system deserves the same urgency. Ask one blunt question: if this data is exposed ten years from now, does it still hurt?
If the answer is yes, move it higher on the list.
Customer identity data, confidential research, regulated financial records, health information, legal archives, and national security-adjacent data usually need earlier attention. Short-lived session data may sit lower, depending on context.
Migration Will Be Uneven
Post Quantum cryptography won’t arrive as one neat upgrade.
It’ll look more like years of overlapping changes: protocol updates, certificate changes, endpoint support, network device upgrades, application testing, audit updates, and policy rewrites. Some teams will move quickly. Others will be stuck behind legacy systems that can’t handle larger keys or changed handshake behavior.
That’s normal. Annoying, but normal.
Hybrid Cryptography Deserves a Serious Look
Hybrid cryptography combines current public-key methods with Post Quantum algorithms. The idea is simple: keep trusted classical protection while adding protection against future quantum attacks.
Is that extra complexity worth it?
Often, yes. Especially during transition periods, when standards are newer, application behavior needs testing, and teams don’t want a hard cutover across critical infrastructure. Hybrid models can reduce risk while allowing security teams to learn from pilots instead of betting the whole environment on one migration wave.
Test Where Performance Actually Matters
Some PQC algorithms involve larger keys, larger signatures, or different computational behavior. That may be fine for a modern cloud service. It may be less fine for latency-sensitive systems, bandwidth-constrained environments, older appliances, or high-volume authentication flows.
Don’t assume. Measure.
A good pilot should test certificate behavior, TLS negotiation, VPN performance, device compatibility, logging visibility, failover behavior, and rollback procedures. The rollback part gets skipped too often.
How do Popular Cybersecurity Vendors Help here?
Cryptography sits inside security infrastructure, not beside it. Firewalls, VPNs, secure access platforms, endpoint controls, identity integrations, and network security services all depend on cryptographic trust decisions.
Several educational resources on quantum-resistant security are now available through established cybersecurity platforms. They can help enterprise teams understand the challenges associated with Post Quantum cryptography.
As organizations begin assessing long-term cryptographic risks, these resources provide useful guidance for discussions between network, security, and infrastructure teams.
The real evaluation question isn’t whether a product page mentions quantum. It’s whether the organization can move toward standards-based cryptographic updates without creating fragile workarounds or redesigning half the stack under pressure.
That conversation belongs in architecture and procurement reviews now. Not after the deadline appears.
Preparation Outperforms Guesswork
Post Quantum cryptography is not about guessing the exact date when quantum computers will threaten today’s public-key encryption. Nobody can give that date with confidence. The better question is how much long-term cryptographic risk the business is comfortable carrying while it waits.
Security leaders have seen this movie before. Migrations take longer than expected. Forgotten dependencies appear late. Systems that looked isolated turn out to support revenue, compliance, remote access, or customer trust.
The practical path starts with inventory, data classification, pilot testing, hybrid planning, and sharper procurement questions. Post Quantum cryptography is becoming part of long-range cybersecurity strategy because the risk is tied to time. And time, as usual, is the one control security teams don’t get to patch later.
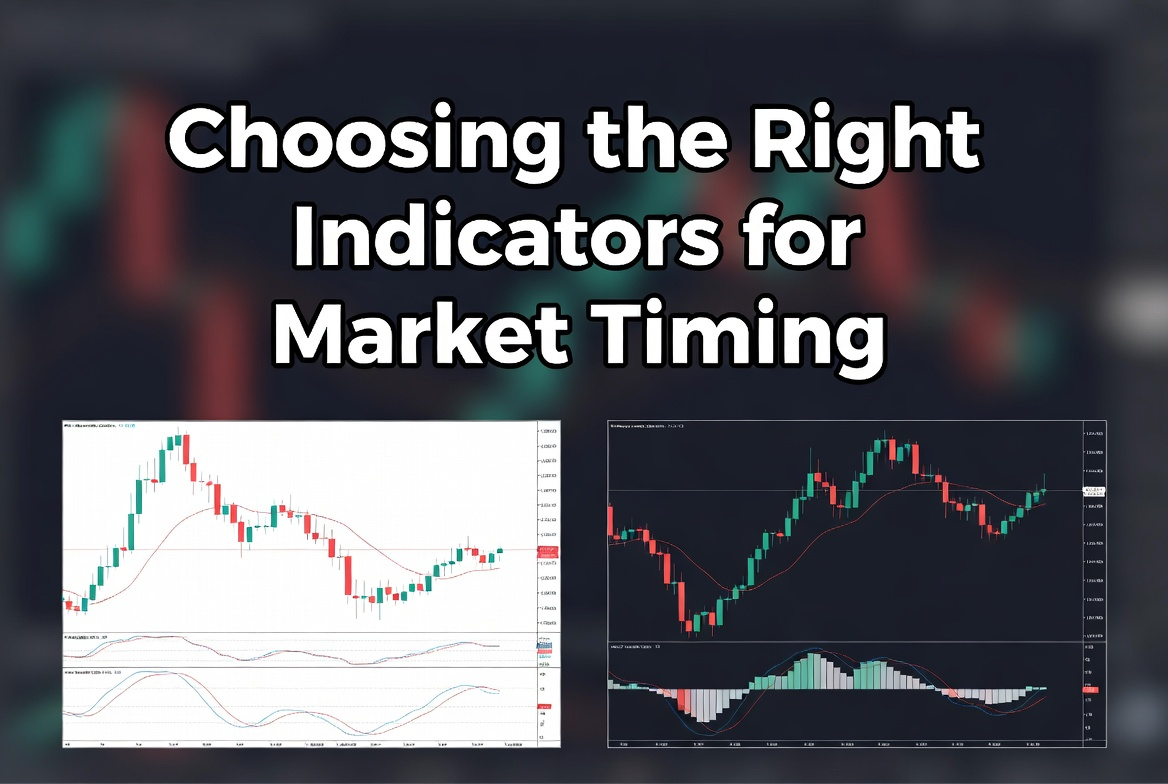
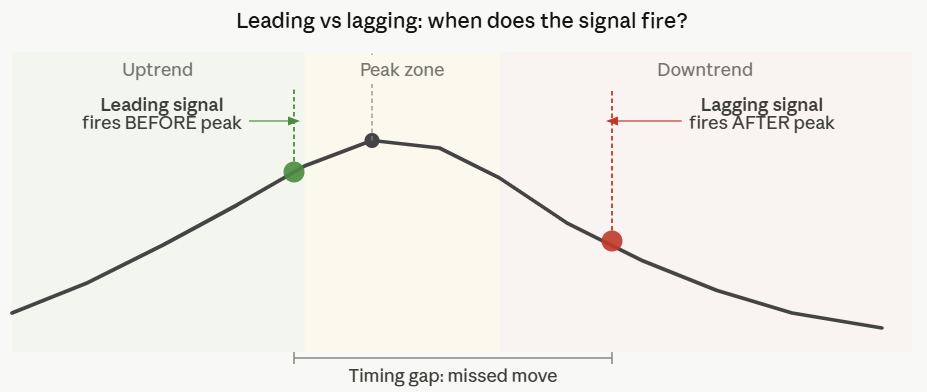
Every indicator on a trading chart is either looking ahead or looking back. That distinction sounds simple, but getting it wrong costs real money. A leading indicator fires a signal before the move is confirmed, giving you an early entry with better risk-reward but more false signals. A lagging indicator waits for confirmation, reducing false entries but giving you a worse price. Understanding leading and lagging indicators and knowing when to use each one is one of the most practical skills in technical analysis.
What Leading Indicators Do and How They Work
Leading indicators are built on the idea that momentum changes before price direction changes. A trend does not reverse instantly. First it slows, then it stalls, then it turns. Leading indicators try to catch that slowdown before the reversal becomes visible on the price chart itself.
Most leading indicators are oscillators that measure the speed or magnitude of recent price changes rather than the direction of price itself. RSI compares the average size of up-moves to down-moves over a set period and outputs a value between 0 and 100. Readings above 70 suggest the market is overbought and a correction may follow. Readings below 30 suggest oversold conditions. The Stochastic Oscillator works on similar logic, comparing current price to its range over a recent period.
The most powerful leading signal these tools produce is divergence. When price makes a new high but RSI makes a lower high, it means momentum is weakening even as price is still rising. That divergence between price and indicator is a warning that the move is running out of fuel. It does not guarantee a reversal, but it shifts the odds enough to warrant attention. Divergence setups consistently offer earlier entries and better risk-reward ratios than waiting for price to confirm the turn.
What Lagging Indicators Do and Why They Still Matter
Lagging indicators work the other way. They are calculated from historical prices and confirm what has already happened rather than predicting what is about to happen. A simple moving average is the clearest example: it takes the average price over the last 20 or 50 candles and plots it as a smooth line. When the fast MA crosses above the slow MA, the uptrend is already in progress.
The cost of that confirmation is entry price. By the time a moving average crossover fires, a portion of the move has already happened. The benefit is reliability: a confirmed trend is far less likely to reverse immediately than a speculative leading signal.
MACD is the most widely used lagging indicator in retail trading. It measures the distance between two exponential moving averages and plots their difference as a histogram. When the MACD line crosses above the signal line, it confirms bullish momentum. Bollinger Bands show price relative to its recent volatility range. When price touches the upper band, it is statistically extended relative to recent history. When the bands contract to a narrow squeeze, it signals that a large move is coming but does not say which direction.
Parabolic SAR places dots above or below price candles based on recent trend behavior. When the dots flip from above to below, it confirms a bullish trend is underway. Simple, visual, and always a beat behind the actual turn.
Key Differences at a Glance
The practical difference between the two types comes down to timing and error type. Leading indicators give earlier signals and better entry prices, but generate more false positives. Lagging indicators generate fewer false signals but give worse entry prices because they confirm moves that have already started.
The table below summarizes the key characteristics:
| Feature | Leading indicators | Lagging indicators |
| Signal timing | Before price confirmation | After trend is established |
| Entry price | Better (earlier) | Worse (later) |
| False signal rate | Higher | Lower |
| Best market condition | Range, consolidation, reversals | Trending markets |
| Common examples | RSI, Stochastic, CCI, divergence | MA crossovers, MACD, Parabolic SAR |
| Main risk | Acting on signals that fail | Missing the early part of the move |
Neither type is superior. Each is suited to specific market conditions. Leading indicators work best when the market is ranging or near a turning point. Lagging indicators earn their keep in strongly trending markets where momentum carries price in one direction for extended periods.
How to Combine Them in a Strategy
The most effective approach uses both types together. The leading indicator identifies a potential setup. The lagging indicator confirms that the setup has enough momentum to follow through. This combination reduces false entries without sacrificing the entry price too much.
A common pairing: RSI divergence as the leading signal, MACD crossover as the confirming filter. When RSI shows bearish divergence at a resistance level and MACD then crosses bearish, the two independent signals pointing in the same direction significantly improve the probability of a successful short trade. Either signal alone is weaker. Together they create a case that is harder to argue with.
Another practical combination is using Bollinger Band squeeze as a leading setup trigger. When the bands contract to an unusually tight range, volatility is coiling. You then wait for a breakout candle and use a moving average direction as the lagging confirmation of which way to trade the expansion.
Reading the Context Before Picking an Indicator
One mistake traders consistently make is applying the same indicator to all market conditions. RSI is a powerful tool in a ranging market. In a strong trend, it stays in overbought territory for weeks and generates constant false reversal signals. Moving averages perform beautifully in trending markets but whipsaw endlessly in consolidation.
Before choosing an indicator, identify the current market phase. Is the market trending or ranging? Is volatility expanding or contracting? A trending phase calls for lagging confirmation tools. A ranging or transitional phase calls for leading oscillators watching for momentum shifts. Getting that context right first makes the choice of indicator straightforward.
Conclusion
Leading and lagging indicators are not competing tools. They are complementary parts of the same analytical process. Leading indicators tell you where the market might be going before it gets there. Lagging indicators tell you when it has already committed to a direction. The most reliable trading setups occur when both types agree, when a leading signal anticipates a move and a lagging indicator confirms it shortly after. Learning to read both, understanding their limitations, and matching them to the current market condition is what separates traders who use indicators intelligently from those who add them to charts and wonder why they keep giving conflicting signals.

Buying a trading platform and buying a trading platform solution are different decisions. The first gives you software; the second is supposed to give you a working business, including client management, payments, branding, and a route to going live. The harder questions are what a solution genuinely covers, what it leaves to you, and how its timelines and costs hold up once the marketing language is stripped away.
Key Takeaways
- A trading platform solution is the complete operational package for running a brokerage, not just the software that executes trades.
- The pieces that have to work together are the platform, client management, payments, branding, and the integrations that connect them.
- Launch and migration timelines scale with scope, and the hidden costs sit in third-party integrations and the technical work on your side.
- A genuine solution shortens setup, but it never removes the need for your own decisions about structure and branding.
What the Word Solution Should Cover
A solution is only worth the label if its parts are built to work together. That means the trading platform, a CRM for managing clients and introducing brokers, a payment layer, and the integrations between them arriving as one connected environment, not a list of components you assemble yourself. The difference shows up in week one: connected pieces work on day one, while assembled pieces need configuration before they do.
Vendors use the word loosely, so it pays to check what is bundled and what is sold separately. A packaged trading platform solution, for instance, may combine the platform, a client office, and a payment integration into a single setup. Still, the integration count almost always includes third-party services that bill separately. A solution that is cheaper on the platform line and silent on integration fees is not cheaper; it is less transparent.
The Costs That Do Not Appear on the Quote
Two costs routinely surprise operators after they sign. The first is integrations: bridges, liquidity, payment providers, and external tools that a pre-built ecosystem connects to quickly, but each charges its own fees. The second is the technical work on your side, because a vendor handles configuration, but a launch still requires your team to make decisions about structure, branding, and which tools to connect to.
Neither cost is a reason to avoid a packaged solution, but both should be included in the comparison. A setup that genuinely shortens launch is worth paying for, while a setup that hides its running costs behind a low headline is not. The useful question is not what the platform costs, but what the working stack costs once all fees and every hour of your team’s time are counted.
Be Realistic About Launch and Migration
Timelines are where expectations and reality drift apart. A launch on a pre-integrated stack can move quickly, but migration from an existing platform varies most, taking anywhere from a week to a few months, depending on what is being moved and how much data comes with it. Treat any fixed multi-quarter estimate, or any promise of an overnight switch, with equal suspicion.
The scope of the move drives the timeline more than the vendor does. A migration from a long-established MetaTrader setup tends to be lengthier than moving a smaller or newer book, because there is more history to carry. A provider that quotes the same migration window regardless of your data volume is guessing, and a careful one will scope the move before committing to a date.
A trading platform solution is worth buying when its parts are genuinely integrated, its costs are stated in full, and its timelines are scoped to your situation rather than a brochure. Pressure-test those three things, and the gap between a real solution and a repackaged platform becomes obvious.
Frequently Asked Questions
What does a trading platform solution include?
A complete solution combines the trading platform with client management, a payment layer, branding, and the integrations that tie them together, set up to work as one environment. The point is that you run a connected stack rather than sourcing each part yourself. How much is genuinely bundled, versus billed separately, varies by vendor.
How long does it take to launch and migrate?
A launch on a pre-integrated stack can be relatively quick, while migration from an existing platform can take anywhere from a week to a few months, depending on data volume and scope. A move from a long-established MetaTrader setup tends to take longer. Be wary of both fixed multi-quarter quotes and promises of an instant switch.
Does a solution remove the technical work on my side?
No, a vendor handles configuration and integration, but a launch still needs basic technical input from your team. You make the decisions about structure, branding, and which tools to connect. A solution shortens the work; it does not eliminate it.

How to Explore Customer Service and Call Center Careers

Account Safety 101: How to Vet Any Instagram Growth Service

What Makes Underground Streetwear Hit? Breaking Down the MF DOOM Shirt and Parke Hoodie Hype

Unlocking Peak Performance with AMD Ryzen X3D: A Gamer’s Ultimate Guide

5 questions every Sydney homeowner should ask before hiring a plumber

Transforming Business Efficiency with Modern Workplace Solutions

The 15 Highest-Paid Rugby Players in the World

Christopher Dare: The Untold Story of Engineer and Former Husband of Angela Rippon

How to Ensure Your Home is Valued Correctly for a Quick Sale

What Is Fanquer? The Digital Creator Platform Transforming Direct-to-Fan Engagement

Dr Jared Ross: Missouri Appeals Court Upholds Protection Order Over Graphic Torture and Murder Threats

Nancy Hallam: The Inspiring Life, Career, and Success Story Behind Ian Wright’s Wife
The 15 Highest-Paid Rugby Players in the World
Christopher Dare: The Untold Story of Engineer and Former Husband of Angela Rippon
How to Ensure Your Home is Valued Correctly for a Quick Sale
What Is Fanquer? The Digital Creator Platform Transforming Direct-to-Fan Engagement
Dr Jared Ross: Missouri Appeals Court Upholds Protection Order Over Graphic Torture and Murder Threats
Nancy Hallam: The Inspiring Life, Career, and Success Story Behind Ian Wright’s Wife
-
 Sports5 months ago
The 15 Highest-Paid Rugby Players in the World
-
Celebrity10 months ago
Christopher Dare: The Untold Story of Engineer and Former Husband of Angela Rippon
-
 Real Estate8 months ago
How to Ensure Your Home is Valued Correctly for a Quick Sale
-
 Technology4 months ago
What Is Fanquer? The Digital Creator Platform Transforming Direct-to-Fan Engagement
-
 Celebrity4 months ago
Dr Jared Ross: Missouri Appeals Court Upholds Protection Order Over Graphic Torture and Murder Threats
-
Celebrity11 months ago
Nancy Hallam: The Inspiring Life, Career, and Success Story Behind Ian Wright’s Wife
-

 Health9 months ago
Enclomimed 25 (Enclomiphene) – Effective PCT Protocol
-
 Celebrity11 months ago
Who Is Maisie Mae Roffey? The Private Life, Family Story, and Quiet Success of Julie Walters’ Daughter